

As we wrap up yet another season of fantasy football, one practice that I find helpful each offseason is looking at the scoring tiers for each position. By reviewing tiers, fantasy owners can better calibrate what their target point total should be on a weekly basis when determining what to expect when counting on players in certain positions and roster spots – i.e. RB1, RB2, etc. This can also be especially helpful when comparing a season to prior years to potentially identify trends, or maybe determining certain results as outliers.
Now, a quick approach to attempt to gauge what it took to be a QB1 during a specific season might be to pull up the end of year scoring and find the QB who finished at #12 (assuming a 12 team league) and determine his points per game. However, this might provide you with a misleading result. By calculating points per game based on the end of year finishing position, you’re just determining what it would take to finish as the #12 QB.
What you really want is the true threshold for what you should expect from a player on a weekly basis, and the better way to determine this would be to find the average score of the #12 QB for each week. So, to compare these results, Tom Brady finished as the #12 QB in 2019, the last of the “QB1” tier, with 271.68 total points, 16.98 points per game. However, if you go through and track the fantasy points for the QB that finished 12th at the position each week, the average points per game for that finishing slot is 19.15. More than 2 points higher than what Brady averaged!
But who has the time to do that?! Well, me, I guess! So, to save you the hassle here are the results for each position and the tier thresholds a player would have needed to reach on a weekly basis to be considered a WR1 or WR2, etc. In addition to the traditional thresholds, I have also included the average points for the 5th place finisher at each position to establish a “Superstar” threshold. Also included is a tier just below the “startable” level based on the position to provide perspective.
Now before we get started, please note that all fantasy points referenced below are based on Yahoo scoring, which is 4-points per passing TD as well as 0.5 PPR. Also, the tiers listed under each position are the 2019 results. However, results from the prior four seasons are reflected in each graph. Enjoy!
Complete early mock drafts using our free draft simulator ![]()
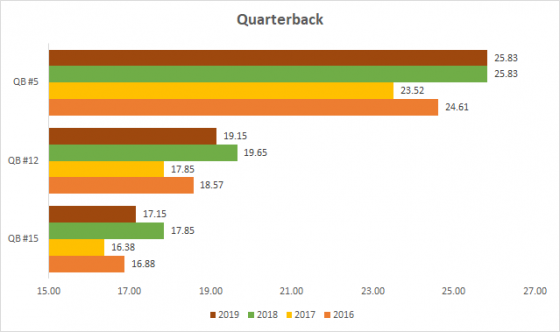
Quarterback
- Superstar Threshold (Average #5 QB): 25.83
- QB1 Threshold (Average #12 QB): 19.15
- Outside Startable Range (Average #15 QB): 17.15
In what might have felt like a down year for QBs based on the drop in production from Aaron Rodgers, the loss of Andrew Luck to start the season, and the many backup QBs that were forced into duty, on a weekly basis the position held it’s own. When looking at 2016-2018, the 2018 season provided a nice increase in average points from the #5 and #12 QBs. While 2019 saw a slight decrease from the #12 QB on a weekly basis, dropping 2.58% compared to 2018, the #5 QB matched the 2018 numbers.
So, while we didn’t see a 50 TD season, or even a 40 TD season for that matter, on a week-to-week basis, fantasy owners continued to see higher production from the Superstar and QB1 level. Based on this, it appears that maybe 2018 wasn’t just a fluke, but potentially the start of a trend. As we look toward 2020, 19-20 fantasy points should be considered the threshold when considering a QB a starting option.
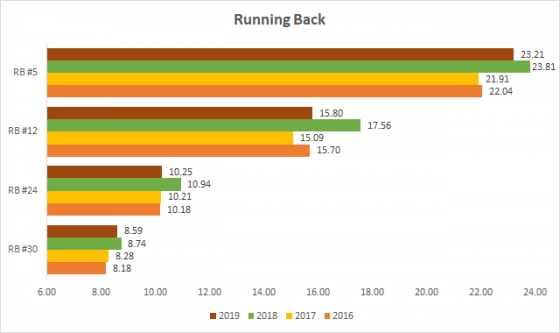
Running Back
- Superstar Threshold (Average #5 RB): 23.21
- RB1 Threshold (Average #12 RB): 15.80
- RB2 Threshold (Average #24 RB): 10.25
- Flex Worthy Threshold (Average #30 QB): 8.59
Personally, the running back position provides me some unexpected results when comparing the past four seasons, as I didn’t recall 2018 to be that much of an outlier, but it appears it may have been. The Superstar RBs were great again this season, with a threshold of 23.21 fantasy points, over a full point higher once again compared to what we saw in 2016 and 2017.
However, the number that jumped out to me when taking a look back at the position was the jump of the RB1 threshold in 2018, with the #12 RB averaging 17.56 points per game. This result was 11.6% higher when comparing the 2018 threshold to the average from 2016, 2017, and 2019. So when I first went to review the numbers, I expected 2019 to jump out based on how the position felt this season, but in fact, it looks like this year was more in line with what we saw prior to 2018, and that maybe the 2018 season was a bit of an outlier.
Wide Receiver
- Superstar Threshold (Average #5 WR): 22.62
- WR1 Threshold (Average #12 WR): 17.01
- WR2 Threshold (Average #24 WR): 12.16
- Flex Worthy Threshold (Average #30 WR): 10.55
It’s not a secret that the wide receiver position was a hard one to nail down this past season. With plenty of early-round picks dealing with injuries, fantasy owners saw a lot of new faces at the top of the rankings at season’s end along with some point totals that left fantasy owners disappointed. For example, DeAndre Hopkins, who finished as the #5 WR in 2019 with 217.54 points, would have finished as the #11 WR in 2018 with that same point total.
So, while we saw a decrease in the numbers when looking at the end of the year standings, the weekly results were fairly consistent. Superstar WRs continued to put up 22+ points on average, and the WR1 threshold continued to hold steady at 17.01. If anything, when looking back at the prior four seasons, it appears that 2017 was an outlier for the position as that season ranked last across average points at each threshold.

Tight End
- Superstar Threshold (Average #5 TE): 14.10
- TE1 Threshold (Average #12 QB): 8.95
- Outside Startable Range (Average #15 TE): 7.25
And finally, the tight end position, which was actually the only position of the four that saw 2019 produce the top superstar and top 12 thresholds compared to the three previous seasons. Now the 2019 TE1 threshold did only average 0.01 more than 2016, it was still good to see that threshold bounce back after a down year in 2018. The big surprise might have been that the superstar threshold saw its best average over any of the previous three years by more than half a point per game. Based on these results, it could be looked at that the top-end TEs are due to regress a bit in 2020, which might be the case based on this comparison sample.

Well, there you have it. I hope you found this useful and helpful when taking a look back at 2019. Be sure to keep these numbers in mind as well for next season as it’s easy to come up with a point target when setting your lineup, but knowing what the expectation should be for a specific position can help keep things in perspective.
Complete early mock drafts using our free draft simulator ![]()
Subscribe: iTunes | Google Play | Spotify | Stitcher | SoundCloud | TuneIn | RSS
Kyle August is a featured writer at FantasyPros. For more from Kyle, check out his archive and follow him @kyleFFfellas


