

Beyond our fantasy baseball content, be sure to check out our award-winning slate of Fantasy Baseball Tools as you prepare for your draft this season. From our free mock Draft Simulator – which allows you to mock draft against realistic opponents – to our Draft Assistant – which optimizes your picks with expert advice – we’ve got you covered this fantasy baseball draft season.
As you may have heard, there were quite a few home runs hit in Major League Baseball last season. The league shattered the record for most home runs hit in a single season. That led to wide speculation about the nature of the baseball, and it has become pretty much accepted that the baseball got altered recently.
I dug into some data and tried to uncover some new, interesting information.
2020 Draft Kit: View printable cheat sheets, sleepers & mistakes to avoid ![]()
Homers Per Plate Appearance
I wrote a Python script to retrieve the last 100 years of total plate appearances and home runs data from baseball-reference.com. I then plotted the previous 50 to show the long term trend in home runs:
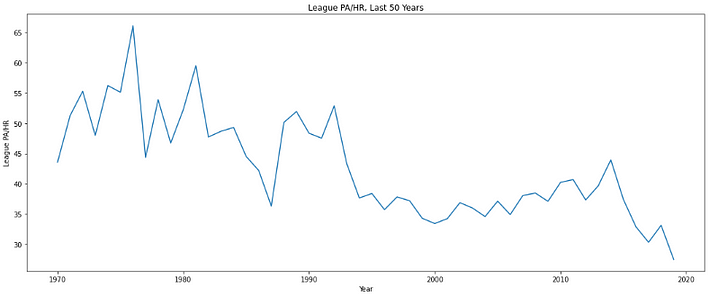
One home run was hit for every 27 plate appearances last year, the first time the league has ever broken the 30 mark (30.4 is second-highest in 2017).
The rise in home runs did not exactly come overnight, as 2015 really seems like the year when the dramatic shift happened — home runs came down from a 44-plate appearance phenomenon to one that occurs ever 37.4 PAs.
Next, I wanted to check a bit of seasonality. I have the pitch-by-pitch data sets from Baseball Savant for each of the last three seasons. These data sets have the full information of every pitch thrown in baseball; every event in every game is quantified in this data.
Here is a 10-day rolling averages graph for PA/HR for each of those seasons. This shows the PA/HR rate for the last ten days for each day of the season.

This analysis can help us identify if the baseball has changed again in 2020 (or 2021, whenever we actually see baseball again). You can see the vast difference between 2019 and 2018, with the 2017 line still being above the 2019 line for most of the year.
If we can start plotting the same line for this/next season, we should be able to pick up on any significant differences within 50 days or so. It will take longer than that to feel really confident, but it’s good evidence. Note that it will be essential to plot the line using time of year instead of time in-season since the weather is a big factor here.
Launch Velocity & Angle Comparisons
Another good way to learn more about the baseball itself is to compare similar types of batted balls for each of the last three years and see what it looks like.
We can use Baseball Savant’s “Barrel” definition to help us with this. The algorithm classifies each batted ball into one of six categories based on the launch angle and velocity. Balls with a velocity of 98 miles per hour that fall within a specific angle range (this range dynamically changes with the velocity) are classified as a barreled ball.

The makeup of the baseball may not change the frequency of barreled balls, and that’s because at least some of the baseball’s effect would not come into play until after contact. While I’m unsure myself about the physics of all this, I believe it’s at least possible for a change in the baseball to result in greater average exit velocity as the ball leaves the bat. I do know that I have seen the rate of barreled balls increase over the last three seasons. Here are those barrels per plate appearance rates:

This could be mostly attributable to a greater and greater focus on launch angle from hitters, so it’s tough for me to make a judgment on this.
I was curious to see if barrels went for home runs at a higher rate in 2019 than the previous years, so I went and checked.
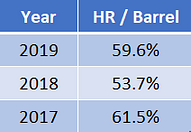
There’s a significant difference between 2018 and the other two years there. It’s interesting to see with 2017 with the lowest rate of barrels but the highest home run percentage on said barrels.
Since the weather does certainly play a part in this, I re-did the above calculations — but this time, I only used games played in Los Angeles. I chose LA because two teams play in that area (more data!), and the weather is probably the most consistent in California from March to September compared to the rest of the country.

We see a similar result, with 2018 lagging behind 2017 and 2019.
I thought it would also be a good idea to check the distance traveled on very similarly struck balls over these three seasons. For that, I collected all batted balls that were hit between 25 and 27 degrees and with a velocity between 102 and 106 and then compared their average distance traveled. Here are the results:

And here are the results for just games in Los Angeles:

Very similarly struck baseballs traveled five feet further on average in 2019 compared to 2018, and that difference balloons up to 11 feet when we control for the weather in a rough way.
PA/HR Change vs. Batted Ball Profile Change — Correlations
Given the obvious change between 2018 and 2019, I was curious to see if we could identify a type of hitter that benefited the most from the change to the baseball.
This process was a bit convoluted, so I’ll do my best to summarize my actions here:
- I retrieved plate appearances per home run data for every player with 250 plate appearances in both 2018 and 2019 from FanGraphs by using a Python script.
- I also retrieved batted ball data (soft and hard-hit percentage, fly ball and ground ball percentage, pull and opposite hit percentage) from FanGraphs in that same manner.
- I calculated the differences for each category mentioned above from 2018 to 2019.
This gave me a huge table of hitters that looked like this:

This example is sorted by FB%, so those five hitters are the five guys who saw the biggest positive changes in their fly ball percentages from 2018 to 2019. For proof, check Eaton’s Batted Ball data yourself from FanGraphs. He had a 26.3% fly-ball rate in 2018 and a 40.4% rate in 2019 — a change of 14.1%.
I then did a correlation matrix of all of these numerical columns. That should help us see which stats are most and least correlated with the change in HR/PA rates:
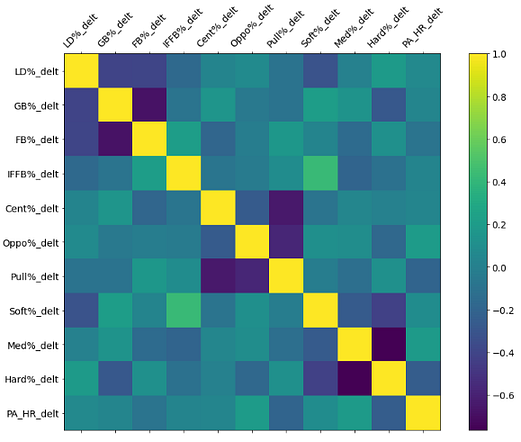
The closer the correlation coefficient is to +1 or -1, the stronger the correlation. In this case, the yellower or bluer a square is, the higher the correlation.
Here is another view of it that shows the actual numbers:

We are focused on that bottom row (or furthest right column — they are the same). We can see that the stats that stick out are hard-hit percentage and pull percentage. As a hitter’s hard-hit and pull percentage come up, their PA/HR will go down (a negative correlation), resulting in more home runs.
In layman’s terms: hitters that start hitting the ball harder and pulling the ball more frequently are likely to see an increase in their home run rate.
No *expletive*, right? It’s the most obvious thing in the world that a hard-hit ball is likelier to be a home run, and it’s only slightly less obvious to a baseball fan that a pulled ball is more likely to go for a home run as well, but hey — at least we have some colorful numbers to prove that now.
One possibly useful thing to come out of this is the data table I gave you a peak of above. I have cleaned it up and published the whole thing on Google Sheets here. Give that a look, as all the columns are sortable so you can go check out which hitters showed the greatest changes in all categories from 2018 to 2019.
Application
The most useful part of all this will be to give us some baselines on what to look for with future data. We can perform all of the previous experiments on new data after a couple of months of games to make a pretty confident guess as to if and how the baseball has changed.
We can also use this information to feel a bit better about predicting which hitters will see more or fewer home runs throughout the year than what we were originally expecting. If a guy comes out and hits 10 bombs in a month when we wouldn’t normally expect it, you could check to see if he’s pulling the ball more than in previous years. If so, you can feel a bit more confident that the change is for real since the data does show a correlation there.
I hope you enjoyed this analysis, and there are a million different directions we could take this for further exploration — so please reach out to me if you have any ideas, or if you have any questions about using Python and MLB data together.
Practice fast mock drafts with our fantasy baseball software ![]()
Subscribe: Apple Podcasts | Google Play | SoundCloud | Stitcher | TuneIn


