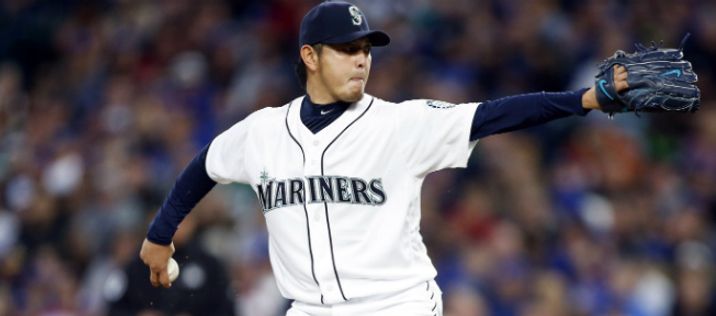
Hisashi Iwakuma holds the World Baseball Classic record for IP with 20
In two weeks, a South Korean pitcher will toe the rubber and hurl the first pitch of the fourth World Baseball Classic. This delivery will kick off a 16-day tournament where players from around the world don their countries colors in the quest for global bragging rights.
Several MLB players will suit up with an anticipated 63 All-Stars set to play in this year’s classic. The prospect of meaningful March baseball is exciting for baseball fans, but the excitement doesn’t come without anxiety in some circles.
I am unaware of any clubs that prohibit their players from participating in the tournament. However, a longstanding concern exists among fans who fear negative implications, more specifically, the impact the WBC may have on pitchers.
It’s true that pitchers who participate forfeit the opportunity to shake off rust or work on mechanics in a controlled Spring Training environment. And yes, these guys are ramping up to max effort earlier than they would in a non-WBC year.
But is there any real and measurable impact on their performance? Do participants enter the regular season rustier than usual? Will they tire out in the second half? Are they more likely to sustain an injury? Those are the questions I set out to answer.
Complete a mock draft in minutes with our free Draft Simulator ![]()
Do pitchers who participate in the WBC enter the season rustier than usual?
I identified every starting pitcher who threw 40+ major league innings in the first half of their WBC season, as well as the prior season. The data allowed me to compare the skills of each participant in a WBC year vs. a non-WBC year. Here are those results for the 37 pitchers in this study.
| Velocity | K% | BB% | GB% | xFIP |
| -0.34 MPH | -1.4% | 0.6% | -2.5% | 0.36 |
Right off the bat, there appears some truth to this narrative. By every measure, pitchers performed worse in the first half than they did the previous year. Provided the average pitcher’s age was 28.2 years old, we can’t simply write this off to age-related skills decline.
Pitchers are creatures of habit, so it’s understandable that veering from their spring routine could impact their ability to get up to speed for Opening Day. The 1.4% drop in strikeout rate over the first half won’t cripple a pitcher’s strikeout totals — we’re talking six-to-seven fewer Ks. However, the decline in punch outs combined with a slightly increased walk rate and a noticeable dip in groundballs adds up to a visible xFIP jump.
Do pitchers who participate in the WBC wear down earlier than usual?
As with the previous data set, I gathered every starter who threw 40+ major league innings in the second half of their WBC year, as well as the prior season. Here are those results for the 30 pitchers who qualified for this study:
| Velocity | K% | BB% | GB% | xFIP |
| -0.52 MPH | -0.3% | -0.2% | -1.1% | 0.13 |
From a calendar perspective, pitchers are tacking an additional month onto their workloads. However, Hisashi Iwakuma’s 20 innings in the 2009 Classic stands as a tournament record. Yes, participants are ramping up earlier than usual, but the workload is similar to what they’d experience in spring training and doesn’t have any grave consequences on the tail end of their season.
While it’s a vast improvement over the first half sample, WBC participants still struggled to get all the way back to their prior year selves. On average, velocity lagged a half mile per hour behind, and the groundballs came back some, but not all the way. The strikeout and walk rates leveled off as the group posted a similar, albeit slightly higher, xFIP.
If you were wondering what these skills comparisons look like over the course of the full season, here is the data for 44 starters who fit the same criteria.
| Velocity | K% | BB% | GB% | xFIP |
| -0.41 MPH | -0.8% | -0.1% | -1.5% | 0.19 |
Collectively, WBC starters haven’t quite been able to replicate their prior year’s skills. Still, considering the negligible difference, and modest sample size, I am not making any significant revisions of my draft board — at least not based on skills expectation. However, that leads to the last question.
Are pitchers who participate in the WBC at increased risk for injury?
Here is a breakdown of the number of DL trips and the average length of stay on the disabled list.
| DL Trips | 2006 | 2009 | 2013 | All-Time |
| Participants | 18 | 14 | 12 | 44 |
| Trips to DL | 5 | 7 | 8 | 20 |
| DL% | 28% | 50% | 67% | 45% |
| Avg. Days on DL | 62 | 65.6 | 61.8 | 63.2 |
Whoa. Nearly half of the pitchers sampled hit the disabled list later that season; missing an average of two months. An effort to explain these injuries turned up empty as I found no correlation between age (or any other metric) and trips to the DL.
But before we lose our minds over the result, it’s important to remember this — every pitcher is an injury risk. Jeff Zimmerman has found that an average year consists of 40% of starters visiting the disabled list. The results suggest WBC pitchers demonstrate a slightly higher risk of injury, but it’s difficult to make any definitive conclusions with a limited sample size.
The results have my attention, but I won’t be avoiding WBC pitchers as increased injury liabilities. Ultimately, the response to these findings depends on each individual’s comfort level with risk. If you’re inclined to adjust your draft board in light of these outcomes, Baseball Reference has compiled the 2017 WBC rosters.
Next year we’ll add another group to the data set on what will be an interesting narrative to revisit in 2021.
Subscribe: iTunes | Stitcher | SoundCloud | Google Play | TuneIn | RSS
Chris Bragg is a correspondent at FantasyPros. For more from Chris, check out his archive or follow him @loosemoose6.