The two most popular places for baseball player data are FanGraphs and Baseball Savant (where Statcast data lives). These websites both have their own unique flavors, but naturally, there is a lot of overlap. There are some areas where these websites are trying to capture the same thing, but using slightly different means to get there. We will highlight a few of these differences in this article so we can have a better understanding of what we are looking at.
Prep for your draft with our award-winning fantasy baseball tools ![]()
FanGraphs was really ahead of its time on this, being the first major website to publish statistics that give information about the quality of batted balls. They have this data going way back to 2002, well before radar guns and slow-motion cameras were pointing at the batter. So how did they do this?
The way that Statcast tells you how well a ball was hit is simple — it knows the velocity and angle of the ball immediately after leaving the bat. The way FanGraphs categorizes a batted ball (soft, medium, hard, ground ball, line drive, fly ball) is a bit more complicated, but it uses the time the ball was in the air and where it landed as its main inputs. If a ball is in the air for less than a second and lands five feet from home plate, you do not need any more information to know that was a ground ball. If the ball is in the air for six seconds and lands in the left fielder’s glove, you know that was a fly ball, and so on.
This difference in method results in different outputs. For example, Christian Yelich had a 50.8% hard-hit rate last year per FanGraphs, but a 49.1% mark per Statcast. We also see FanGraphs having Yelich with a 43.2% ground ball rate last year, while Statcast calls it a 42.8% rate. The differences will always be small, as there are not many possible types of batted balls that would end up being classified differently by these differing methods, but you absolutely will see these discrepancies.
So what is the difference for fantasy players? In general, the differences in hard-hit rate are insignificant, I would not say that one site has better data just because of how close the numbers are to each other, but gun to my head I would choose the Statcast data and cite Occam’s razor in the process (the idea that the simplest way is the best way).
One thing that is important to note is that Statcast has more categories for classifying batted balls. When you view a player’s Baseball Savant page, you will see rates for “Weak,” “Topped,” “Under,” “Flare/Burner,” “Solid,” and “Barrel,” while you see just “Soft” “Medium,” and “Hard” on FanGraphs. In a lot of cases this may bring in some unneeded complexity and confusion, but it is a more full picture of what happened. Here is the breakdown of the six categories that Statcast uses:
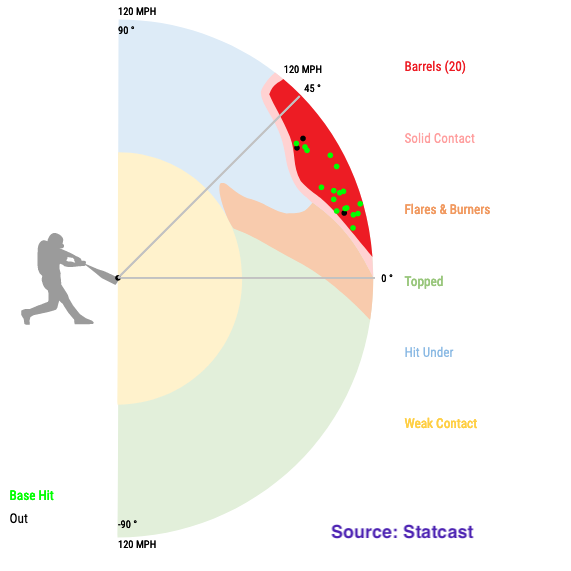
Not only do these categories give you information about how hard the ball was hit, but they give you an idea of the angle as well – which is just as important. A guy could have a really high hard-hit rate on FanGraphs, but he won’t have much success if he’s hitting balls hard and directly into the ground. This is a win for Statcast.
One last thing that is important to know is which stats include plate appearances that did not end with a ball being put in play. On FanGraphs, the hit percentages (hard, medium, soft) always add up to 100%. That means these are percentages based on all balls in play, not plate appearances. The same is true for Barrel Rate on Statcast. You should always have strikeout rate and walk rate in mind. Joey Gallo’s elite quality of contact is a bit less enticing when you realize that over half of his plate appearances result in a walk or a strikeout. You can use stats like Barrels Per Plate Appearance to account for this. It’s important to know exactly what you’re looking at when checking some advanced metrics and I hope this post helped a bit in that regard.
Practice fast mock drafts with our fantasy baseball software ![]()
Subscribe: Apple Podcasts | Google Play | SoundCloud | Stitcher | TuneIn
Jon Anderson is a featured writer at FantasyPros. For more from Jon, check out his archive and follow him @JonPgh.