
Should you buy Jake Lamb in spite of his second-half collapse?
It’s often unwise to parse a player’s full-season stats into halves, as the sample sizes are smaller and less meaningful. Having said that, sometimes a player’s second-half surge or face plant warrants a deeper dive into the numbers to determine if a sustainable change occurred. This series will look at players who surged in the second half last year and those whose production took a nose dive. Today, I’ll look at the infield, including catchers.
Prepare for your fantasy baseball draft using our Draft Simulator tool ![]()
Surgers
| Half | AVG | OBP | SLG | HR | wRC+ |
| First | .215 | .281 | .425 | 13 | 85 |
| Second | .288 | .358 | .594 | 19 | 153 |
Gattis’ season started in the middle of April due to his placement on the 15-day disabled list to start the year while he continued his rehab from off-season sports hernia surgery. He had a sluggish first half in which he hit for power, but his batting average was cut down at the knees by a .228 BABIP. The low BABIP was supported by an inability to square up line drives (15.3% LD%), too many ground balls (47.1% GB%) and a pull-happy approach (50.6% Pull%) that paired horrifically with his propensity for hitting worm burners. According to FanGraphs, 51 plate appearances in the first half of last year resulted in a pulled ground ball from Gattis, and predictably he tallied an awful average (.137) on that batted ball type. Teams played a traditional shift against him for 40 of his plate appearances in the first half, and he hit just .200.
In the second half, Gattis exploded due to dramatic, positive changes to his batted ball profile. He kicked his line drive rate up to 20.8%, reduced his groundball percentage to 34.4% and kicked his flyball percentage up from 37.6% to 44.8%. Gattis also was less pull happy with a 42.2% Pull%, and he used the middle of the field more with a 41.6% Cent% compared to a 32.4% Cent% in the first half. As a cherry on top, he hit the ball harder increasing his Hard% from 31.8% to 33.1%. With a more well-rounded batted ball distribution, he was shifted against for just 23 of his plate appearances and torched opponents with a .409 average. Prior to last year, Gattis owned a 41.3% FB% and just a 42.4% GB% with a 34.4% Hard%. I wouldn’t go as far as extrapolating Gattis’ second-half numbers across a full season, but his batted ball profile in the second half is more in line with his previous work than his first half’s profile. The Astros brought Carlos Beltran and Brian McCann (more on him to come) into the mix, and they could cut into Gattis’ playing time at designated hitter and catcher, respectively. Beltran should still see some time in the corner outfield, and between donning the tools of ignorance and picking up some starts at designated hitter when Beltran plays the field, I’m optimistic Gattis will play 125-130 games again this year.
| Half | AVG | OBP | SLG | HR | wRC+ |
| First | .288 | .367 | .435 | 8 | 112 |
| Second | .284 | .354 | .593 | 22 | 146 |
Han-Ram had a fine first half last year, but he enjoyed a blistering second half as a result of muscling up more. He increased his homer output by 14 dingers in the second half in 78 fewer plate appearances (349 plate appearances in the first half and 271 in the second half). As you’d probably guess, he did a much better job lifting the ball (30.6% FB% in the first half and 35.8% in the second half) down the stretch than he did out of the gate. That wasn’t the only notable change, though, as he also upped his Pull% from 35.4% to 41.1%, and his Hard% rose from 35.4% to a robust 39.5%. I’m buying the changes he made in the second half, and I’ll speculate that settling in at a less demanding defensive position helped him focus on his offense. Speaking of defense, Ramirez will likely play less of the field this year with David Ortiz retired. Alex Speier of the Boston Globe quoted GM Dave Dombrowski as saying, “Hanley wants to DH a lot.” Also, Drew Silva of NBC Sports’ Rotoworld tweeted Ramirez is a .331/.381/.634 hitter as a DH. The sample size of DH plate appearances (155) for Ramirez is tiny, but he’s clearly not going to sulk about not playing the field if he wants to DH, perhaps lessening the chance of suffering the DH penalty (more on that here and here). Ramirez’s single-season high for homers in a year is 33 set back in 2008, so I won’t go as far as projecting him to keep up his second-half pace of 40-plus taters over a full season, but I do believe a third season of 30 or more homers is well within reach.
| Half | AVG | OBP | SLG | HR | wRC+ |
| First | .246 | .335 | .450 | 14 | 110 |
| Second | .291 | .344 | .646 | 28 | 156 |
I mean, you had to see Dozier’s inclusion in this piece coming from a mile away, right? He doubled his homer output from the first half in a torrid finish to his 2016 campaign, obliterating his previous single-season high of 28 homers set the year before with 42 long balls. Dozier sold out for power after the break hitting 49.1% of his batted balls in the air and pulling a jaw-dropping 59.1% of his batted balls. He was yanking everything in the air, and he was doing so with authority with a 41.8% Hard%. Dozier’s FB% has increased every year in the majors, and he actually pulled the ball more in 2015 (60.2% Pull%) than last year (56.4% for the full season), so his second-half yank it in the air approach was nothing new.
The biggest change was in his Hard% which sky rocketed from 28.6% in the first half to 41.8% in the second half. The second baseman had never eclipsed a 30% Hard% in a full season in the majors, making that aspect of his second-half surge unexpected. With a much longer track record of sub-30% Hard% — including last year’s first half — I’ll throw a wet blanket on thoughts of another 40-plus homer season. However, Dozier might be capable of retaining some of his new found Hard%, and eclipsing 30 homers this year feels attainable. Giving back double-digit homers won’t help Dozier’s batting average, and 10 fewer dingers in 2016 that all resulted in outs would have dropped his average from .268 to .252. Steamer is projecting Dozier for 25 homers and a .248 average. As I noted above, I think Dozier can hit the 30-homer threshold, and with a few more dingers than Steamer’s projection, I expect him to hit between .250-.255.
Collapsers
| Half | AVG | OBP | SLG | HR | wRC+ |
| First | .248 | .347 | .462 | 14 | 118 |
| Second | .236 | .321 | .351 | 6 | 84 |
As promised, here’s the more on McCann. He face planted to close out his tenure with the Yankees. He struggled to loft the ball with his FB% dropping from 47.8% to 39.5%. The result was a cliff dive in homers from 14 to six, and pulling the ball on the ground with teams shifting resulted in a continued low average. Mike Podhorzer of FanGraphs recently unveiled a new xBABIP, and among the biggest losers in the new xBABIP calculation was McCann. The veteran catcher greatly benefited from Yankee Stadium’s lefty homer-friendly park factors and smacked 46 homers with a .230 ISO and 120 wRC+ in 796 plate appearances at home in his three seasons (2014-2016) with the Yankees. During that same three years, he hit just 23 homers with a .134 ISO and 81 wRC+ in 769 plate appearances on the road. Minute Maid Park also amplifies homers for lefties, but not to the same degree Yankee Stadium does. Couple the park factor changes that accompany being dealt from the Yankees to the Astros with his drop in flyball rate in the second half of last year, and McCann’s a hard pass for me in fantasy drafts.
| Half | AVG | OBP | SLG | HR | wRC+ |
| First | .286 | .351 | .522 | 19 | 134 |
| Second | .223 | .316 | .381 | 9 | 91 |
The former top prospect in baseball and 2013 American League Rookie of the Year broke out in a big way last year with a 28/28 season. He set single-season highs across the board, and the most important factor was good health. He played in 157 games and totaled 676 plate appearances. His previous highs in the majors were 88 games and 373 plate appearances set in his rookie season of 2013. Myers’ season was a tale of two halves, though.
He earned an All-Star appearance on the heels of a big first half, and his production cratered in the second half. One positive from the second half was that he continued to run (13 stolen bases) and remained efficient (caught stealing only three times). A second positive was that his walk rate improved from 9.5% to 10.8%. Unfortunately for Myers, his strikeout rate swelled from 20.6% to 27.6%, his ISO dropped from .236 to .158, FB% dropped from 35.6% to 31.3% and Hard% dropped from 36.6% to 29.1%. Dennis Lin of The San Diego Tribune touched on the possibility of Myers tiring but ultimately concluded that the struggles were more mental than physical. I’m going to speculate fatigue may have played a bigger role in Myers’ struggles than Lin conceded, as Myers had played in more than 150 games only one other time in his professional career (152 games split between Triple-A and the Majors in 2013), and he’d played in only 160 games across all levels in 2014 and 2015 combined. The 26-year-old’s sizzling June (11 homers, .327/.429/.765 and 209 wRC+ in 119 plate appearances) inflate his full-season totals from last year, but his true talent level also is likely greater than his woeful months of July and August. Myers ended the year in September and two games in October with a 9.6% BB%, 21.6% K%, five homers, a .255/.336/.455 triple slash and 112 wRC+ in 125 plate appearances. The first baseman’s last month and a couple games makes for a nice baseline for projections for 2017 and actually lines up reasonably well with his full season of work last year (10.1% BB%, 23.7% K%, .259/.336/.461). Sprinkle in some potential for growth with his first full, healthy season in The Show in his rear view mirror, and I’ll be targeting Myers despite some ugly numbers during the dog days of the summer in 2016.
Matt Carpenter (1B/2B/3B – STL)
| Half | AVG | OBP | SLG | HR | wRC+ |
| First | .298 | .420 | .568 | 14 | 162 |
| Second | .229 | .316 | .410 | 7 | 93 |
I’ll keep it short and sweet with Carpenter. Sure, the performance difference between halves last year was stark, but poor health looks like the greatest culprit for the lackluster showing to close last year. Derrick Goold of the St. Louis Post-Dispatch had some telling quotes from Carpenter in a piece he penned last October. I’d suggest reading the linked article, but the cliff notes version is that Carpenter never felt comfortable after hitting the disabled list with an oblique injury in July, “and he modified his swing to avoid aggravating the injury.” Carpenter’s new stroke from 2015 that helped him set a career-high in homers that year carried over to last year, and he actually improved his walk rate (12.2% to 14.3%), strikeout rate (22.7% to 19.1%), FB% (41.7% to 43.2%) and Hard% (37.0% to 41.9%) while pulling the ball more (39.3% to 48.1%). The power is legit, and there might be some untapped batting average upside beyond the low .270s averages he’s sported the last two years. Buy, buy, buy Carpenter, and if you can get even a slight discount as a result of his post All-Star break numbers, take advantage of it.
| Half | AVG | OBP | SLG | HR | wRC+ |
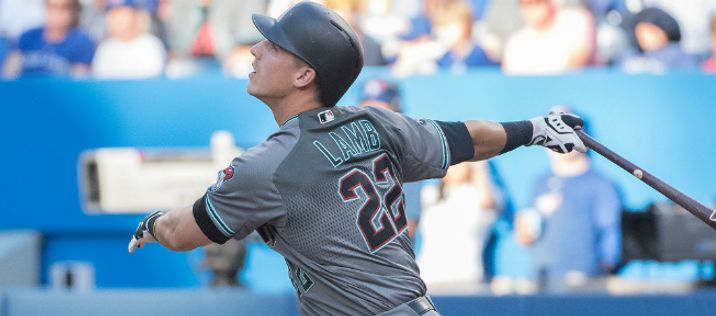
| First | .291 | .371 | .612 | 20 | 151 |
| Second | .197 | .283 | .380 | 9 | 68 |
Lamb broke out in the first half last year and then turned into a pumpkin. But did he really turn into a pumpkin, or is there another reason he failed to such a great extent? Lamb suffered a bruised left hand when he was jammed by a pitch in a two-game series against the Blue Jays in late July. From July 22nd through the end of the year, Lamb hit .182/.275/.350 with eight homers, a .221 BABIP, 60 wRC+ and a 12.2% LD% in 244 plate appearances. Perhaps it’s not fair to completely absolve him of any responsibility for his poor numbers in the second half, but it certainly looks like there’s a strong correlation between the bruised hand and his collapse. Lamb continued to walk at a great 11.5% clip even after suffering the bruised hand, and while his 27.9% K% was high, it would have been palatable if it was accompanied by the homer output from prior to the injury. Lamb’s stumbles in closing out last year look to be chiefly the product of an injury. I’m extremely bullish on Lamb’s outlook this year.
Subscribe: iTunes | Stitcher | SoundCloud | TuneIn | Google Play
Josh Shepardson is a featured writer at FantasyPros. For more from Josh, check out his archive and follow him @BChad50.