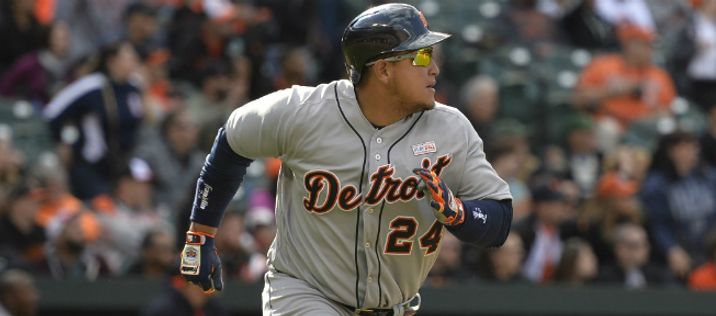

Elite hitters like Miguel Cabrera tend to have higher BABIPs
In the vast majority of fantasy leagues, there’s a very limited range of stats that actually count. We all know it’s important for hitters to have good runs and RBI totals and for pitchers to rack up strikeouts and wins. The problem with only using these statistics in evaluation is that they aren’t very predictive, often telling you very little about a player’s actual ability and usually having more to do with context and luck, especially over smaller sample sizes.
Prepare for your fantasy baseball draft using our draft simulator tool ![]()
Fortunately, it’s now very easy to look beyond the standard 5-by-5 roto stats and dig deeper into a player’s statistical profile. Sites like FanGraphs, Baseball-Reference and Baseball Prospectus have player cards and sortable leaderboards that allow users to search for and export all manner of statistics. This can help you to produce a much more complete evaluation of players than can be achieved by simply looking at those stats which get counted in fantasy. What’s not always so clear is how these ‘peripheral’ stats are relevant, what’s good or bad, and how they should be used. To that end, I’ve identified a few of the key stats that fantasy players will find useful and described how to use them. In this installment, we take a look at how the various batted ball stats can inform our fantasy decisions, focusing on the key element of batting average on balls in play, or as it’s usually referenced, BABIP.
BABIP
The concept of BABIP will likely be familiar to a lot of owners, although it’s not always applied correctly. This measures how often a ball put in play actually goes for a hit. For that reason, home runs do not count, as they’re not technically ‘in play.’
BABIP is important because it can reveal when a player is getting particularly lucky or unlucky. The league-average BABIP is .300, but while it’s not unreasonable to expect players to regress towards that mark, it’s a mistake to assume that all players will actually have a .300 BABIP, especially if that player has a long history of having a BABIP higher or lower than that. Don’t be surprised to see elite and/or very fast hitters with high BABIPs. Mike Trout’s career mark is .360. Miguel Cabrera’s is .347. Pitchers have less control over their BABIP than hitters, but we can still expect to see low marks, such as Clayton Kershaw’s .271. A team’s defense, the player’s approach and quality, and simple luck are all factors that come into play.
Batted Ball Profile
The role of a player’s speed and batted ball profile are fairly intuitive when thinking about BABIP. Faster players, all else being equal, should have a higher BABIP on ground balls, simply because they should be able to beat out more hits than slow players. However, the three types of batted balls have very different BABIP levels. It’s, therefore, useful to look at the line drive (LD%), ground ball (GB%) and fly ball (FB%) rates for a player when thinking about BABIP.
Line drives are great. They’re balls that tend to be hit hard, at a good angle, and so they’re much more likely to fall for hits and often go for extra bases, too. The league had a collective .680 BABIP on line drives in 2016. Ground balls are mediocre. Sometimes they find their way through the infield, or can be beaten out for hits, but much more often they find a glove and are simple outs. The league BABIP on ground balls was .239 in 2016. Fly balls are the worst. Sometimes they still drop in for doubles or triples, but the vast majority of the time they drop for easy outs. League BABIP was just .127 for fly balls last year.
| Batted Ball Type | League BABIP |
| Ground Ball | .239 |
| Line Drive | .680 |
| Fly Ball | .127 |
There is no one set profile of successful fantasy players, but there are broad factors that can be applied, especially in relation to certain categories. For batting average, it’s good to see a hitter with a lot of line drives (25% and up is very good). Hitters who hit a lot of flyballs generally also tend to have a high number of home runs and extra-base hits, but they will have lower batting averages than a hitter who hits a lot of groundballs. A pitcher with a high ground ball rate (over 50%) will often have more success because they are often outs, and even when they aren’t, they generate less offense than fly balls do. None of these are absolutes. Pitchers can succeed with a flyball-heavy approach, and batters who don’t hit a ton of line drives can still be very valuable. We can use batted ball types to identify an improvement that can be made to a player’s batted ball profile, or a particular characteristic that makes a player a sustainable outlier where ordinarily regression would be expected.
Take Billy Hamilton. Arguably the fastest player in the majors, his first two full seasons had an average BABIP of .304 and a well below average of .264. Hamilton undoubtedly had some bad luck in 2015, but he was also a player who hit too many fly balls for his speed to come into play, around 37% in both seasons. With a change in approach in 2016, Hamilton cut that FB% down to just 30%, turned them into ground balls and put up a .329 BABIP. The Reds outfielder still doesn’t have a great plate approach, but by changing his batted ball mix he was able to capitalize on his best tool.
Marco Estrada is a great example of a pitcher who’s able to run a BABIP well below .300 because of his approach. Estrada pitches up in the zone to induce a lot of pop-ups. He’s currently on a streak of six straight seasons with an infield fly ball rate (infield fly balls divided by total fly balls, abbreviated as IFFB%) of 11% or more. Estrada is a pitcher who generates close to 50% flyballs anyway, so over 5% of his batted balls each year are infield flies, and sometimes it’s as much as 7-8%. Infield flies are the biggest BABIP killers of all, and it’s hardly surprising when you think about what happens to those. They’re almost universally outs, and when they aren’t, they’re errors. In each of those six seasons, Estrada’s BABIP has been under .300, and his career mark is .256. That’s what happens when so many of your batted balls are essentially guaranteed outs, and 50% of them are less likely to fall for hits than any other batted ball type.
It’s also crucial to remember that BABIP takes a very long time to stabilize. FanGraphs notes that it takes around 800 balls in play for a hitter, and 2,000 for a pitcher. That’s close to two seasons worth of hitting data and a little over three for a pitcher, so don’t go drawing any conclusions about a pitcher’s true talent BABIP after they’ve pitched half a season in the majors. In the absence of a longer track record, assuming that the player will regress to .300 is sensible, and adjustments can be made accordingly based on the factors noted. For instance, if the player demonstrates an ability to hit line drives at a significantly above-average rate, it’s reasonable to expect that they have a strong approach to hitting that will also sustain an above-average BABIP.
Other batted ball stats that can tell you useful things about a player’s profile include the location percentages. FanGraphs has these listed as Pull%, Cent%, and Oppo%. Again, there’s no one way to be successful with these. Brian Dozier has made himself into an incredibly valuable player by almost exclusively pulling a ton of home runs down the line, but those with a more balanced approach are less susceptible to shifts and certain pitching approaches. A hitter like Chris Davis who’s known for predominantly pulling the ball and particularly hitting a lot of grounders to that side can have a lot of hits taken away by simple shifts. Those hitters can still succeed, but Davis likely has a lower batting average now than he would have done in an era with fewer shifts because he’s such a clear shift candidate based on his batted ball mix.
Home Run to Fly Ball Rate
Home run to fly ball rate (HR/FB) is another key peripheral that is brought up a lot. It can often be useful for figuring out whether a player, especially a pitcher, is getting particularly lucky or unlucky with the amount of fly balls that are finding their way over the fence. The league average over the last decade has tended to be in the 9-11% range, but last season’s home run spike was associated with a 12.8% rate – hitters weren’t hitting more fly balls, but more of those fly balls were leaving the park.
Again, it’s crucial to use this in the context of other stats and information about a player’s profile, as well as the park they play in. We shouldn’t expect Ben Revere, who has six career home runs, to regress back towards a league average rate, nor should the same be said of extreme power hitters like Davis, or pitchers in extreme environments like Coors Field. However, if a pitcher has normal career rates elsewhere but a high ERA and a 30% HR/FB rate through the first few starts of a season, it’s reasonable to expect that rate to come down and the pitcher’s ERA to improve. How much is another question. No qualified pitcher had a higher HR/FB than Jaime Garcia‘s 20.2% last year, but further information about the pitcher’s approach and quality is needed for a more reasonable assessment.
Hit Rate
That brings us to the last aspect of batted balls to be discussed here, which is how hard the ball is actually being hit. FanGraphs carries this data in the form of Soft%, Med%, and Hard%, but now that Statcast data is widely available, this can also be used to determine whether pitchers are giving up hard contact or hitters are regularly crushing the ball, as well as whether they’re crushing the ball at the right angle.
Particularly interesting is Tom Tango’s recently-created Barreled Ball classification, or ‘Barrels’ on the leaderboard. This measures balls struck at a certain speed – at least 98 mph – and launch angle. The range of launch angles expands as the speed increases. To illustrate why this is informative, I’ll quote directly from that glossary entry which stats that balls given this classification “had a batting average of .822 and a 2.386 slugging percentage.” Players who hit the ball like this regularly in 2016 include Miguel Cabrera, Nelson Cruz, Mike Trout and Mark Trumbo. It’s worth bearing in mind that players who have a very all-or-nothing approach can also do well in this category. Ryan Howard and the recently-DFA’d Byung-ho Park appear towards the top of the Barrels/PA ranking. These players will still give you home runs, but if the approach at the plate is generally poor, it doesn’t mean they’ll give you anything else.
FiveThirtyEight’s Rob Arthur has done some excellent work on using Statcast data to predict OPS, showing that it can often predict whether players are declining or poised for a breakout before the more traditional statistics. Andrew Perpetua has produced similarly useful content at FanGraphs. Statcast data analysis is still in its early stages and there’s much still to be discovered about what the system can tell us. It’s certainly worth using the information available and tracking the research being done to see what else can be learned from this new avenue of batted ball data. Being able to identify a new star a few weeks early or sell high on a player whose outcomes don’t match their batted ball profile could be a real difference-maker to your teams.
Subscribe: iTunes | Stitcher | SoundCloud | TuneIn | Google Play
Darius Austin is a correspondent at FantasyPros. For more from Darius, find his work at Friends with Fantasy Benefits, Banished to the Pen and Bat Flips & Nerds and follow him @DariusA64.