Beyond our fantasy baseball content, be sure to check out our award-winning slate of Fantasy Baseball Tools as you prepare for your draft this season. From our Cheat Sheet Creator – which allows you to combine rankings from 100+ experts into one cheat sheet – to our Draft Assistant – which optimizes your picks with expert advice – we’ve got you covered this fantasy baseball draft season.
We have a number for everything in the baseball statistics world, well, almost everything.
The way I look at it, there are three main components to pitching. “Stuff” (the pitches and quality of pitches thrown), “control” (the ability to locate the pitch where desired), and “deception” (the ability to mask the pitch in some way that makes it harder for the hitter to see or pick up on).
While we can easily quantify the stuff and the control, we don’t have a definitive metric for pitcher deception. How exactly do you quantify it? There is no radar gun or high-speed camera that could capture this. We have to get creative to have a shot at quantifying this, and that’s what I attempted to do in this analysis.
My thought process was that I could use CSW Rate (called strike + swinging-strike rate) and data clustering to give this a try. Let’s talk briefly about both of these things.
Prep for your draft with our award-winning fantasy baseball tools ![]()
CSW Rate
This stat is simply the total of called strikes and swinging strikes that a pitcher earns divided by the total number of pitches thrown. This is a logical statistic to use in my mind because these two events are the best indicators of whether or not a hitter was deceived. You can read more about CSW Rate here.
Data Clustering
Clustering analysis is a data science technique that takes a series of data points and puts them in categories based on their values. In this example, I clustered four-seam fastballs into six different clusters based on their velocity and spin rate.
The Process
To perform this analysis, I used the Baseball Savant pitch-by-pitch data set that has details on every single pitch thrown in the 2019 MLB regular season. This is just one massive table with a row for every pitch thrown, with just about every piece of information you could want about them. For full details about what data points we have in the data, click here. I used Python to get all the information I wanted from this data set. My full Google Colab Notebook with all the coding and results is here.
First thing was to get the data ready to go. I had to make a couple of decisions before proceeding.
If a hitter takes a strike, that often means they either guessed wrong about the location of the pitch or that they were simply not expecting the fastball and were unable to get a swing off on it. However, there is the common scenario where the hitter never considers swinging. It would not be fair to say a fastball was deceptive just because a hitter never wanted to swing at it.
I went through each possible count and found the league-average swing rate in each, here are the results on that:
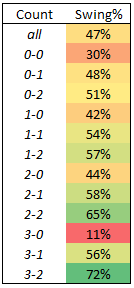
Hitters have almost no interest in swinging on a 3-0 count (swinging just 11% of the time), so I decided to leave all pitches thrown in that count completely out of my analysis. I also considered leaving out the 0-0 count since hitters leave it alone 70% of the time. However, I decided to leave those pitches in because there are just so many of them (every single at-bat has a 0-0 pitch, so taking those out reduces our sample size by a ton), and 70% really isn’t all that huge when you consider that 48% of first pitches are thrown out of the strike zone anyways.
Clustering
This is the most important part of the study. We cannot simply look at all pitchers and say the ones with the highest CSW rates are the most deceptive. Obviously, the quality of the fastballs has a huge hand in CSW rate. Gerrit Cole’s 98 mph, high-spin fastball could not be deceptive in the slightest, but it would still generate a much higher CSW rate than the most deceptive 91 mph, low-spin pitch.
We need to compare pitchers to other pitchers that throw the same fastball as them. Then, we can see which players have the highest CSW rate within those clusters. If two pitchers throw a fastball with the same velocity and same spin, but one pitcher has a much higher CSW rate, there must be something else going on.
One potential issue here is that control does sneak into this a bit. Pitchers with better control will generate more called strikes because they are able to paint the corners and generate fewer swings at strikes. To this point, I am not sure how to best deal with that in this analysis, so I will proceed without trying.
I decided to use six clusters and used the SciKit learn K-Means clustering package to do the math for me. The full details of the clustering are in the Python notebook that I shared earlier, so check that out if you’re interested in more of the nuts and bolts of this.
Here are the details of each of the six clusters I ended up with.
Cluster 1: Low velocity (average 88.8 mph), high spin (average 2200 rpm)
Cluster 2: Medium-high velocity (95.4), average spin (2343)
Cluster 3: Average velocity (93.3), high spin (2434)
Cluster 4: High velocity (97.6), high spin (2379)
Cluster 5: Medium-low velocity (91.3), average spin (2248)
Cluster 6: Average velocity (93.5), low spin (2137)
Here are the three most common pitchers in each cluster:
Cluster 1: Tommy Milone, Yusmeiro Petit, Julio Teheran
Cluster 2: Lance Lynn, James Paxton, Lucas Giolito
Cluster 3: Mike Minor, Matthew Boyd, Richard Rodriguez
Cluster 4: Gerrit Cole, Jacob deGrom, Walker Buehler
Cluster 5: Madison Bumgarner, John Means, Rick Porcello
Cluster 6: Homer Bailey, Shane Bieber, Jake Odorizzi
The Results
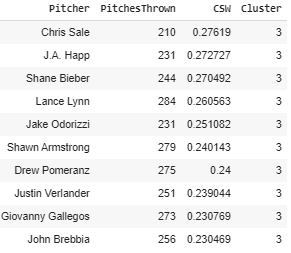
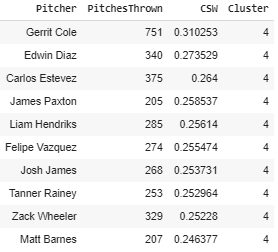
For each cluster, I will show the highest CSW rates overall and then the leaders for pitchers that had 200 or more pitchers in that sample. The purpose for that is to try and isolate some of the starting pitchers.
Here are the results for each of the six clusters:
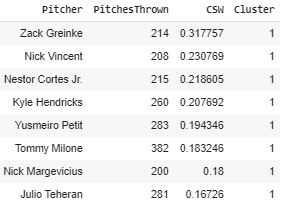
Cluster 1

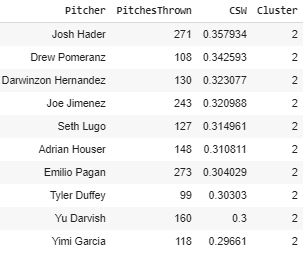
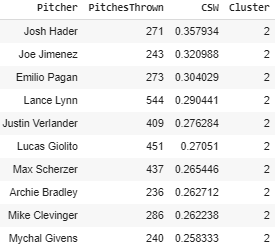
Cluster 2
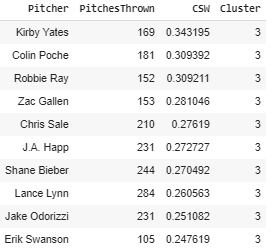
Cluster 3
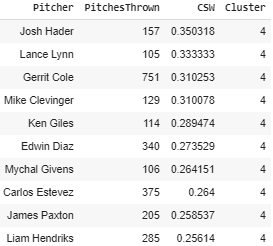
Cluster 4
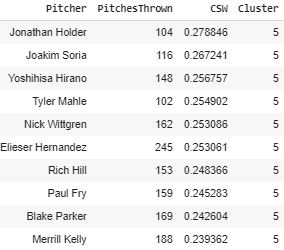
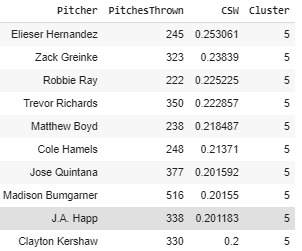
Cluster 5
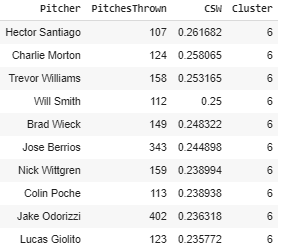
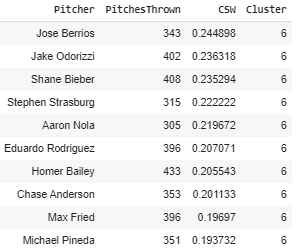
Cluster 6
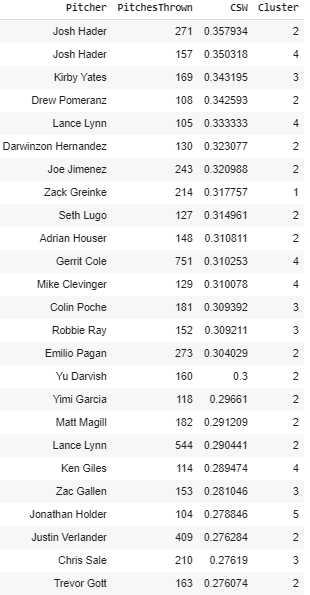
Putting it all together, here are your top-25 most deceptive four-seam fastballs by the confines of this analysis:
We should also check to see which pitchers grade out the best relative to their cluster. Here are the CSW averages for each cluster:
Cluster 1: 18.2%
Cluster 2: 21.9%
Cluster 3: 20.8%
Cluster 4: 22.4%
Cluster 5: 18.5%
Cluster 6: 18.6%
For each pitcher, I took the difference between their CSW rate and their cluster’s average CSW rate to find the overall “winners.” Here are the top-25 overall (using only pitchers that threw 150 or more fastballs that fit into that cluster last year):
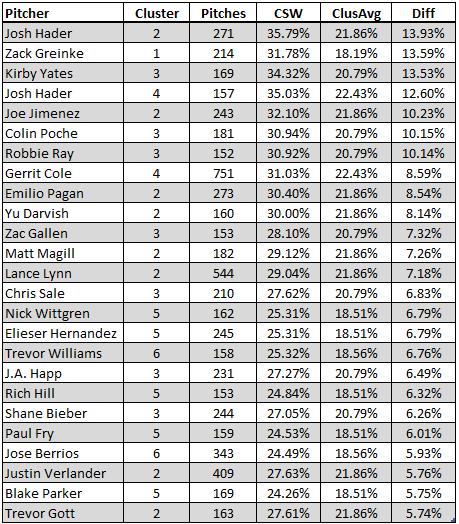
The way to interpret this would be to say, “Josh Hader’s CSW rate on his fastball was 13.9% above the average for pitchers that threw a fastball very similar to his in velocity and spin rate.” This tells us a little bit more about how good his fastball is than just comparing it to the entire league.
The full results are here. They should be filterable and sortable, so feel free to explore them.
Winners
The top dog here is Brewers’ reliever Josh Hader, which makes me feel decent about this analysis being at least somewhat profound. He certainly passes the eye test in deception:
A close second was Zack Greinke, who seems to do a great job hiding the ball for a long time (I say seems to because look, I’m no pitching coach):
Other Notables
Some of the more surprising names that are near the top of the list: Adrian Houser, Hector Santiago, Zac Gallen, Elieser Hernandez, Trevor Williams, J.A. Happ, Merrill Kelly.
You can find out more about the least deceptive pitchers by sorting the data from the link I gave above, but the bottom ten are Jerad Eickhoff, Kyle Gibson, Lou Trivino, Robert Stephenson, Sandy Alcantara, Jaime Barria, Ivan Nova, German Marquez, Justin Anderson, and Jon Gray.
If you have any questions, criticisms, or feedback, you can reach out on Twitter – I’d love to hear from you.
Other links (repeated):
Here is my Python notebook where you can all my code and annotations.
Here are the results data that you can look through.
Subscribe: Apple Podcasts | Google Play | SoundCloud | Stitcher | TuneIn
Jon Anderson is a featured writer at FantasyPros. For more from Jon, check out his archive and follow him @JonPgh.