Week 4 of the 2018 NFL season is in the books and to keep you up to date, we’ve put together an all-in-one spreadsheet filled with several fantasy-relevant statistics from last week and year to date. We call it the Super Chart and its purpose is to provide you with all of the data, stats, and fantasy information you need in one place. Our Super Chart can be used to help determine your starting lineups, waiver wire pickups, trade evaluations, and much more by using various forms of stat-driven data. Tracking critical information such as backfield shares and touches, fantasy points per touch, and weekly matchups can help you identify breakout candidates by noticing trends before other managers in your league.
Before we get to the Week 5 edition of the Running Back Super Chart, please take a moment to review each category and what it means. If you are already familiar with all of the terms and categories, feel free to skip ahead.
View your league’s top available players with My Playbook ![]()
Weekly Fantasy Points/Fantasy Points Per Game (FPPG)
The first stat that we track is simple, yet important. The Super Chart is sorted by Fantasy Points Per Game, but also includes fantasy point totals from the previous week.
Weekly Touches/Weekly Touch %
This is one of the most underrated aspects of fantasy football. As mentioned earlier, studying the percentage of touches for each backfield can help you determine potential breakout and bust candidates in advance.
YTD Touches/YTD Touch %
We not only track weekly touch percentages but also year-to-date touches. Any running back hovering around that 75-80 percent range should be considered a workhorse.
Weekly/YTD Receptions
PPR formats have taken over the fantasy football landscape and tracking receptions is a vital part of finding consistent success. Running backs that don’t catch many passes are usually touchdown-dependent and are more likely to struggle with consistency.
Next Week Opponent
This is pretty self-explanatory. It’s a look ahead to the upcoming matchup with the opposition’s rank against the run in fantasy. The 32nd ranked fantasy defense is a favorable matchup, while the 1st ranked defense is the most difficult.
# of 100 Yard Games
Some leagues offer bonus points at 100 yards rushing, and it’s also a great way to track rushing consistency.
Fantasy Points Per Touch
Lastly, fantasy points per touch can help you identify explosive players who can put up big numbers with more opportunity.
The Super Chart is packed with so much information that we can only fit so much into the article. To view the Super Chart in its entirety, please click here.
*Data taken from ESPN, FantasyPros, and NFL.com.
| Player | WK 4 FP | FPPG | WK 4 Touches | WK 4 Touch % | YTD Touches | YTD Touch % | WK 4 REC | YTD REC | FP Per Touch |
| Alvin Kamara | 41.1 | 34 | 24 | 83% | 91 | 78% | 5 | 35 | 1.5 |
| Todd Gurley | 25.6 | 26.6 | 21 | 100% | 94 | 82% | 4 | 15 | 1.13 |
| Melvin Gordon | 30.9 | 26.4 | 22 | 69% | 78 | 64% | 7 | 24 | 1.35 |
| Saquon Barkley | 22 | 22.6 | 16 | 76% | 83 | 79% | 6 | 27 | 1.09 |
| Ezekiel Elliott | 34 | 21.5 | 29 | 81% | 88 | 92% | 4 | 15 | 0.98 |
| Christian McCaffrey | BYE | 20.9 | BYE | BYE | 68 | 81% | BYE | 22 | 0.92 |
| James Conner | 9.4 | 19.4 | 12 | 100% | 81 | 93% | 3 | 18 | 0.96 |
| James White | 31.2 | 19.1 | 16 | 36% | 43 | 32% | 8 | 22 | 1.77 |
| Adrian Peterson | BYE | 18.2 | BYE | BYE | 61 | 60% | BYE | 5 | 0.9 |
| Joe Mixon | DNP | 17.8 | DNP | DNP | 44 | 44% | DNP | 6 | 0.81 |
| Chris Thompson | BYE | 16.6 | BYE | BYE | 35 | 34% | BYE | 20 | 1.42 |
| Marshawn Lynch | 18.7 | 16 | 23 | 72% | 78 | 57% | 3 | 10 | 0.82 |
| Carlos Hyde | 14.2 | 16 | 22 | 71% | 87 | 74% | 0 | 4 | 0.74 |
| T.J. Yeldon | 23 | 15.8 | 21 | 58% | 63 | 56% | 3 | 14 | 1 |
| Kareem Hunt | 26.5 | 15.7 | 22 | 92% | 75 | 82% | 3 | 4 | 0.84 |
| Austin Ekeler | 13.6 | 14.5 | 10 | 31% | 41 | 34% | 2 | 13 | 1.42 |
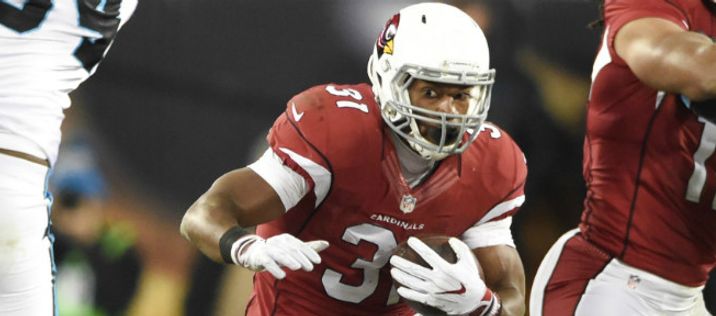
| David Johnson | 18.2 | 14.5 | 25 | 86% | 69 | 73% | 3 | 13 | 0.84 |
| Nyheim Hines | 28.3 | 14.3 | 13 | 56% | 40 | 40% | 9 | 22 | 1.43 |
| Matt Breida | 10.1 | 14 | 12 | 63% | 51 | 47% | 3 | 10 | 1.09 |
| Giovani Bernard | 25.6 | 13.8 | 19 | 73% | 48 | 48% | 4 | 14 | 1.15 |
| Jay Ajayi | 11.1 | 13.7 | 18 | 69% | 41 | 34% | 3 | 4 | 1 |
| Javorius Allen | 6.7 | 13.5 | 12 | 46% | 41 | 38% | 2 | 15 | 1.31 |
| Tevin Coleman | 10.7 | 12.9 | 17 | 63% | 64 | 65% | 3 | 10 | 0.8 |
| Tarik Cohen | 30.4 | 12.7 | 20 | 63% | 41 | 35% | 7 | 14 | 1.24 |
| Dion Lewis | 15.6 | 12.5 | 13 | 57% | 61 | 52% | 9 | 18 | 0.82 |
| Isaiah Crowell | 1.3 | 12.1 | 5 | 29% | 47 | 46% | 1 | 5 | 1.03 |
| Phillip Lindsay | 15.9 | 12.1 | 14 | 56% | 50 | 43% | 2 | 5 | 0.96 |
| Alex Collins | 9.5 | 11.2 | 12 | 46% | 53 | 49% | 1 | 8 | 0.85 |
| Kerryon Johnson | 12.6 | 11 | 10 | 45% | 49 | 43% | 1 | 11 | 0.9 |
| Jordan Howard | 2.5 | 11 | 11 | 34% | 74 | 63% | 0 | 10 | 0.6 |
| Corey Clement | DNP | 10.9 | DNP | DNP | 35 | 29% | DNP | 8 | 0.93 |
| Bilal Powell | 9.2 | 10.8 | 12 | 71% | 49 | 48% | 4 | 10 | 0.88 |
| Chris Carson | DNP | 10.6 | DNP | DNP | 50 | 42% | DNP | 5 | 0.63 |
| Aaron Jones | 15.2 | 10.5 | 12 | 40% | 19 | 19% | 1 | 2 | 1.1 |
| Mike Davis | 28.4 | 10.4 | 25 | 74% | 30 | 25% | 4 | 6 | 1.04 |
| Royce Freeman | 12.7 | 10.4 | 8 | 32% | 45 | 38% | 0 | 1 | 0.92 |
| Lamar Miller | 4.9 | 10 | 14 | 52% | 66 | 68% | 0 | 8 | 0.6 |
| Sony Michel | 17.2 | 9.4 | 25 | 57% | 51 | 38% | 0 | 2 | 0.55 |
| Dalvin Cook | 2 | 9.2 | 10 | 56% | 45 | 54% | 0 | 9 | 0.61 |
| Theo Riddick | 6.7 | 8.9 | 5 | 23% | 26 | 23% | 4 | 21 | 1.37 |
| Jalen Richard | 6.6 | 8.9 | 4 | 13% | 26 | 19% | 3 | 18 | 1.37 |
| Ito Smith | 13.8 | 8.9 | 10 | 37% | 25 | 26% | 3 | 7 | 1.07 |
| Kenyan Drake | 2.6 | 8.1 | 4 | 22% | 43 | 52% | 1 | 10 | 0.75 |
| Devonta Freeman | DNP | 8 | DNP | DNP | 9 | 9% | DNP | 3 | 0.89 |
| Ty Montgomery | 9.4 | 7.9 | 7 | 23% | 27 | 28% | 2 | 11 | 1.17 |
| Darren Sproles | DNP | 7.9 | DNP | DNP | 9 | 8% | DNP | 4 | 0.8 |
| Wendell Smallwood | 8.4 | 7.1 | 8 | 31% | 29 | 24% | 3 | 7 | 0.98 |
| Chris Ivory | 1.5 | 7 | 6 | 7% | 35 | 42% | 0 | 4 | 0.8 |
| LeSean McCoy | 6.7 | 6.9 | 8 | 57% | 29 | 35% | 3 | 8 | 0.71 |
| Alfred Morris | 2.8 | 6.8 | 5 | 26% | 47 | 44% | 1 | 3 | 0.58 |
| Nick Chubb | 22.5 | 6.7 | 3 | 10% | 10 | 8% | 0 | 0 | 2.66 |
| Kyle Juszczyk | 3.5 | 6.6 | 2 | 11% | 8 | 7% | 2 | 8 | 3.28 |
| Frank Gore | 13.7 | 6.6 | 13 | 72% | 38 | 46% | 2 | 3 | 0.69 |
| Leonard Fournette | 4.5 | 6.5 | 12 | 33% | 24 | 21% | 1 | 4 | 0.54 |
| Duke Johnson | 13.6 | 6.4 | 6 | 19% | 21 | 18% | 4 | 9 | 1.21 |
| Jamaal Williams | 2.7 | 6 | 11 | 37% | 52 | 53% | 0 | 5 | 0.46 |
| Jordan Wilkins | 1.6 | 5.8 | 8 | 35% | 45 | 45% | 0 | 7 | 0.51 |
| Mark Walton | 5.7 | 5.7 | 7 | 27% | 7 | 7% | 2 | 2 | 0.81 |
| C.J. Anderson | BYE | 5.6 | BYE | BYE | 13 | 15% | BYE | 1 | 1.3 |
| Derrick Henry | 5.1 | 5.2 | 10 | 43% | 57 | 48% | 2 | 3 | 0.36 |
| Latavius Murray | 5.8 | 5 | 4 | 22% | 26 | 31% | 2 | 7 | 0.77 |
| Malcolm Brown | 0 | 5 | 0 | 0 | 20 | 0.18 | 0 | 2 | 0.76 |
| Alfred Blue | 3.1 | 4.8 | 13 | 48% | 30 | 31% | 0 | 1 | 0.63 |
| Corey Grant | 3.7 | 4.7 | 3 | 8% | 21 | 19% | 2 | 9 | 0.9 |
| Marlon Mack | DNP | 4.6 | DNP | DNP | 11 | 11% | DNP | 1 | 0.42 |
| Peyton Barber | 4 | 4.5 | 8 | 42% | 52 | 63% | 1 | 2 | 0.35 |
| Devontae Booker | 2.4 | 4.3 | 2 | 8% | 19 | 16% | 1 | 8 | 0.89 |
| Chase Edmonds | 0.1 | 4.2 | 3 | 10% | 22 | 23% | 0 | 9 | 0.77 |
| Rashaad Penny | 4.9 | 4.2 | 9 | 26% | 33 | 28% | 0 | 4 | 0.51 |
| Ronald Jones | 3.8 | 3.8 | 11 | 58% | 11 | 13% | 1 | 1 | 0.35 |
| LeGarrette Blount | 1.2 | 3.5 | 7 | 32% | 38 | 33% | 0 | 3 | 0.37 |
| Marcus Murphy | DNP | 3.3 | DNP | DNP | 19 | 23% | DNP | 2 | 0.52 |
| Doug Martin | 1.1 | 3.1 | 5 | 16% | 28 | 21% | 0 | 3 | 0.45 |
| Jacquizz Rodgers | 0 | 2.9 | 0 | 0% | 15 | 18% | 0 | 6 | 0.77 |
| Spencer Ware | 0.6 | 2.7 | 2 | 8% | 10 | 11% | 0 | 3 | 1.09 |
| Wayne Gallman | 3.3 | 2.7 | 5 | 24% | 16 | 15% | 3 | 6 | 0.68 |
| Rod Smith | 3.2 | 1.2 | 7 | 19% | 8 | 8% | 1 | 1 | 0.46 |
| Mike Gillislee | 2.5 | 1.1 | 3 | 10% | 17 | 15% | 1 | 1 | 0.25 |
| Robert Kelley | BYE | 0.4 | BYE | BYE | 4 | 4% | BYE | 0 | 0.2 |
Quick Hits
- Alvin Kamara led the way in Week 4 with 41.1 fantasy points. He also ranks number one in FPPG with 34, first in receptions with 35, and is second in total touches with 91.
- James Conner continues to see the highest share of touches out of any backfield in the NFL with 93 percent. He had 100 percent of Pittsburgh’s backfield touches in Week 4, but only managed 9.4 fantasy points.
- Nick Chubb leads all RBs in fantasy points per touch with 2.66 (min. 10 touches). In comparison, Carlos Hyde is averaging just 0.74. The rookie could see an increase in touches in the coming weeks.
- David Johnson had his busiest day of the season, as he totaled 25 touches and accounted for 86 percent of Arizona’s backfield touches, bringing his average up to 73 percent on the season.
- LeGarrette Blount has taken 33 percent of Detroit’s touches through the first four weeks, despite being grossly inefficient with a 0.37 fantasy points per touch average. Kerryon Johnson should see more work as the season wears on.
Import your team to My Playbook for instant Lineup & Trade advice ![]()
Subscribe: Apple Podcasts | Google Play | Spotify | Stitcher | SoundCloud | TuneIn | RSS
Mike Dente is a featured writer at FantasyPros. For more from Mike, check out his archive and follow him @1ststopfantasy.